2023 English local election
2023 Bournemouth, Christchurch and Poole Council election
|
|
All 76 seats on Bournemouth, Christchurch and Poole Council
39 seats needed for a majority |
|---|
| | First party | Second party | Third party | | |  | | | | Leader | Vikki Slade | Phil Broadhead | George Farquhar | | Party | Liberal Democrats | Conservative | Labour | | Last election | 15 seats, 19.7% | 36 seats, 32.1% | 3 seats, 14.2% | | Seats won | 28 | 12 | 11 | | Seat change |  13 13 |  24 24 | 8 | | Popular vote | 62,537 | 51,323 | 30,417 | | Percentage | 31.4% | 25.8% | 15.3% | | Swing | 9.0% | 6.3% | 1.1% |
| | | Fourth party | Fifth party | Sixth party | | | | | | | Leader | Paul Hillard | Chris Rigby | | | Party | CI | Green | Independent | | Last election | N/A | 2 seats, 7.5% | 11 seats, 14.2% | | Seats won | 8 | 5 | 5 | | Seat change | 8 | 3 | 6 | | Popular vote | 15,231 | 16,915 | 9,050 | | Percentage | 7.7% | 8.5% | 4.5% | | Swing | N/A | 1.0% | 9.7% |
| | | Seventh party | Eighth party | | | | | | Leader | Mark Howell | Judes Butt | | Party | Poole People | Poole Engage | | Last election | 7 seats, 5.4% | 0 seats, 0.3% | | Seats won | 5 | 2 | | Seat change | 2 | 2 | | Popular vote | 5,995 | 6,966 | | Percentage | 3.0% | 3.5% | | Swing | 2.4% | 3.2% | |
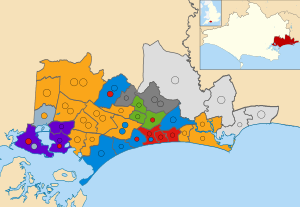 Winner of each seat at the 2023 Bournemouth, Christchurch and Poole Council election |
Leader before election
Philip Broadhead
Conservative
No overall control | Leader after election
Vikki Slade
Liberal Democrats
No overall control | |
The 2023 Bournemouth, Christchurch and Poole Council election took place on 4 May, 2023, to elect all 76 members of Bournemouth, Christchurch and Poole Council in Dorset, England.[1]
The council stayed with no overall control but the Liberal Democrats became the largest single party.[2][3] As no one party controlled a majority of the council the Liberal Democrats, Christchurch Independents, Poole People Party and The Bournemouth Independent Group subsequently formed a coalition administration known as the "Three Towns Alliance."[4][5]
Background
Prior to the election the council was under no overall control, being led by a minority Conservative administration. Eight registered political parties were represented on the council, in addition to eight independent councillors who did not belong to a party. Some of the parties and independents formed political groups:
- The "Poole Independents" group comprised the Poole People Party, the Alliance for Local Living and one of the independent councillors.
- The "Bournemouth Independent and Green" group comprised the Green Party and two of the independent councillors.
The other parties each formed their own groups, and the remaining five independent councillors were not aligned to any group.[6][7]
Councillors standing down
| Councillor | Ward | First elected | Party | Date announced |
| Norman Decent | Kinson | 2019 | | Conservative | 10 May 2022[8] |
| Mike Brooke | Broadstone | 1999 | | Liberal Democrats | 3 November 2022[9] |
| Drew Mellor | Talbot and Branksome Woods | 2019 | | Conservative | 13 February 2023[10] |
| Mike Greene | Bournemouth Central | 2009 | | Conservative | 25 February 2023[11] |
| Nicola Greene | Westbourne and West Cliff | 2007 | | Conservative | 25 February 2023[12] |
| Ann Stribley | Parkstone | 1977 | | Conservative | 30 March 2023[13] |
| Lewis Allison | Boscombe West | 2019 | | Labour | 6 April 2023[14] |
| Peter Hall | Christchurch Town | 2015 | | Conservative |
| Diana Butler | Creekmoor | 2019 | | UKIP |
| Mark Robson | Newtown and Heatherlands | 2019 | | Liberal Democrats |
| L-J Evans | Poole Town | 2019 | | Poole People Party |
| Susan Phillips | Wallisdown and Winton West | 2011 | | Conservative |
| Lisa Lewis | West Southbourne | 2019 | | Labour |
Parties
On 5 April 2023, the full list of candidates was published:[14]
In addition, 33 Independent candidates, and 1 candidate without a description, sought election.
Results
Following the results, the council remained in no overall control but the Liberal Democrats became the largest party with 13 gains.[15] The Conservatives fell sharply from 34 to 12 seats.[16] The Labour Party nearly quadrupled their seat total from 3 to 11.[17] The Green Party went from 2 seats to 5.[18]
| 2023 Bournemouth, Christchurch and Poole Council election[19] |
| Party | Candidates | Seats | Gains | Losses | Net gain/loss | Seats % | Votes % | Votes | +/− |
| | Liberal Democrats | 74 | 28 | | | 13 | 36.8 | 31.4 | 62,537 | +9.0 |
| | Conservative | 75 | 12 | | | 24 | 15.8 | 25.8 | 51,323 | –6.3 |
| | Labour | 55 | 11 | | | 8 | 14.5 | 15.3 | 30,417 | +1.1 |
| | CI | 10 | 8 | | | 8 | 10.5 | 7.7 | 15,231 | N/A |
| | Green | 38 | 5 | | | 3 | 6.6 | 8.5 | 16,915 | +1.0 |
| | Independent | 34 | 5 | | | 6 | 6.6 | 4.5 | 9,050 | –9.7 |
| | Poole People | 8 | 5 | | | 2 | 6.6 | 3.0 | 5,995 | –2.4 |
| | Poole Engage | 16 | 2 | | | 2 | 2.6 | 3.5 | 6,966 | +3.2 |
| | Animal Welfare | 1 | 0 | | |  | 0.0 | 0.1 | 239 | N/A |
| | Reform UK | 1 | 0 | | | | 0.0 | 0.1 | 189 | N/A |
| | Heritage | 1 | 0 | | | | 0.0 | 0.1 | 181 | N/A |
| | Communist | 1 | 0 | | | | 0.0 | <0.1 | 40 | N/A |
UKIP and ALL both lost one seat, but are not shown in the table above as no candidates contested on behalf of those parties.
Ward results
Incumbent councillors are indicated with '‡'.
Alderney and Bourne Valley
Alderney and Bourne Valley | Party | Candidate | Votes | % | ±% |
| | Liberal Democrats | Rachel Marie Maidment‡ | 1,341 | 44.9 | +11.5 |
| | Liberal Democrats | Tony Trent‡ | 1,314 | 44.0 | +7.7 |
| | Liberal Democrats | Adrian David Chapmanlaw | 1,257 | 42.1 | +12.2 |
| | Labour | Celia McCormack | 716 | 24.0 | +6.0 |
| | Labour | Philip Murray | 655 | 21.9 | +4.9 |
| | Labour | Stephen Sinsbury | 613 | 20.5 | +5.7 |
| | Conservative | Lisle Carol Smith | 579 | 19.4 | -4.6 |
| | Conservative | Sam Way | 542 | 18.2 | -0.9 |
| | Conservative | Michael Abraham Labidi | 535 | 17.9 | -1.2 |
| | Green | Renato Roberto Colonna | 371 | 12.4 | N/A |
| | Animal Welfare | Gavin Sean Ridley | 239 | 8.0 | N/A |
| | Independent | Martin David Smalley | 175 | 5.9 | -3.0 |
| Majority | | | |
| Turnout | 2,985 | 25.18 | |
| | Liberal Democrats hold | Swing | | |
| | Liberal Democrats hold | Swing | | |
| | Liberal Democrats hold | Swing | | |
Bearwood and Merley
Bearwood and Merley | Party | Candidate | Votes | % | ±% |
| | Liberal Democrats | David Anthony Brown‡ | 2,502 | 67.5 | +17.7 |
| | Liberal Democrats | Marcus Julian Charles Andrews‡ | 2,482 | 67.0 | +23.4 |
| | Liberal Democrats | Richard Glyn Burton‡ | 2,414 | 65.1 | +24.0 |
| | Conservative | Leona Jayne Allen | 744 | 20.1 | -6.9 |
| | Conservative | Debbie Ferguson | 698 | 18.8 | -3.6 |
| | Conservative | Roger Ashton Gregory | 691 | 18.6 | -3.6 |
| | Green | Alison Randall | 403 | 10.9 | +0.5 |
| | Labour | Siobhan Helen Bardsley | 350 | 9.4 | +4.4 |
| Majority | | | |
| Turnout | 3,706 | 33.48 | |
| | Liberal Democrats hold | Swing | | |
| | Liberal Democrats hold | Swing | | |
| | Liberal Democrats hold | Swing | | |
Boscombe East and Pokesdown
Boscombe East and Pokesdown | Party | Candidate | Votes | % | ±% |
| | Labour | George Farquhar‡ | 1,465 | 58.4 | +28.1 |
| | Labour | Eleanor Connolly | 1,232 | 49.1 | +27.5 |
| | Independent | Andy Jones‡[a] | 429 | 17.1 | -12.3 |
| | Conservative | Mariam Kazem-Malaki | 398 | 15.9 | -13.5 |
| | Green | Mike Squires | 332 | 13.2 | -13.4 |
| | Conservative | Gayatri Balakrishna Lokhande | 326 | 13.0 | -8.2 |
| | Liberal Democrats | Rebecca Sian Edwards | 307 | 12.2 | -6.1 |
| | Liberal Democrats | James Robert Lees | 187 | 7.5 | -6.6 |
| Majority | | | |
| Turnout | 2,507 | 31.90 | |
| | Labour hold | Swing | | |
| | Labour gain from Conservative | Swing | | |
- ^ Elected as Conservative
Boscombe West
Boscombe West | Party | Candidate | Votes | % | ±% |
| | Labour | Patrick Canavan | 629 | 36.9 | +2.5 |
| | Labour | Gillian Mary Martin | 627 | 36.8 | +6.8 |
| | Conservative | Jane Kelly‡ | 578 | 33.9 | -3.2 |
| | Conservative | Sarah Rehana Choudhury | 457 | 26.8 | -6.1 |
| | Liberal Democrats | Paul Radcliffe | 423 | 24.8 | +7.2 |
| | Green | Nick Tidiman | 327 | 19.2 | -9.6 |
| | Liberal Democrats | Reverend Ian Whitham | 188 | 11.0 | N/A |
| | Independent | Philip James Stanley-Watts | 177 | 10.4 | -22.5 |
| Majority | | | |
| Turnout | 1,703 | 21.67 | |
| | Labour gain from Conservative | Swing | | |
| | Labour hold | Swing | | |
Bournemouth Central
Bournemouth Central | Party | Candidate | Votes | % | ±% |
| | Conservative | Hazel Elizabeth Allen‡ | 663 | 32.9 | -6.9 |
| | Labour | Jamie Paul Martin | 640 | 31.8 | +15.4 |
| | Conservative | Ed Down | 534 | 26.5 | -15.0 |
| | Independent | David Smith | 488 | 24.2 | -5.2 |
| | Labour | Ian Paul Prankerd | 450 | 22.3 | +8.7 |
| | Green | Jon Crewe | 352 | 17.5 | -3.8 |
| | Liberal Democrats | David George England | 255 | 12.7 | +2.8 |
| | Independent | Alan Zaczek | 198 | 9.8 | N/A |
| | Liberal Democrats | Martin Alistair Rodger | 179 | 8.9 | +0.9 |
| Majority | | | |
| Turnout | 2,014 | 21.99 | |
| | Conservative hold | Swing | | |
| | Labour gain from Conservative | Swing | | |
Broadstone
Broadstone | Party | Candidate | Votes | % | ±% |
| | Liberal Democrats | Vikki Slade‡ | 2,564 | 69.2 | +2.0 |
| | Liberal Democrats | Peter Thomas Sidaway | 2,307 | 62.2 | -4.8 |
| | Conservative | David Mark Newell | 912 | 24.6 | +0.6 |
| | Conservative | John Leslie Bill | 909 | 24.5 | +4.2 |
| | Green | Soo Chapman | 218 | 5.9 | N/A |
| | Labour | Robin William Phillips | 171 | 4.6 | +1.4 |
| Majority | | | |
| Turnout | 3,707 | 43.28 | |
| | Liberal Democrats hold | Swing | | |
| | Liberal Democrats hold | Swing | | |
Burton and Grange
Burton and Grange | Party | Candidate | Votes | % | ±% |
| | CI | Simon Jonathan McCormack‡ | 727 | 40.6 | -4.5 |
| | CI | David Anthony Flagg‡ | 652 | 36.4 | -14.8 |
| | Conservative | Michael Adams | 445 | 24.8 | +9.3 |
| | Conservative | Samuel Nicholas Joynson | 385 | 21.5 | +6.2 |
| | Liberal Democrats | Robert Franklin Dawson | 365 | 20.4 | +14.1 |
| | Liberal Democrats | Alinda Jane Howland | 304 | 17.0 | +11.6 |
| | Labour | Simon Peter Charles Dawson | 228 | 12.7 | -9.8 |
| | Green | Graham Paul Kendrick | 155 | 8.7 | +0.7 |
| | Green | Deb Sutton | 134 | 7.5 | N/A |
| Majority | | | |
| Turnout | 1,791 | 25.42 | |
| | CI hold | Swing | | |
| | CI hold | Swing | | |
Canford Cliffs
Canford Cliffs | Party | Candidate | Votes | % | ±% |
| | Conservative | May Yuen Haines‡ | 1,711 | 56.4 | -5.5 |
| | Conservative | John Ernest Challinor | 1,680 | 55.4 | -2.2 |
| | Liberal Democrats | Ray Sparrow | 620 | 20.4 | +3.1 |
| | Liberal Democrats | Rich Douglas | 513 | 16.9 | +5.3 |
| | Labour | Jim Buchanan | 291 | 9.6 | +3.8 |
| | Green | Johnny Tutton | 267 | 8.8 | N/A |
| | Poole Engage | Sheridan Burnett | 261 | 8.6 | N/A |
| | Poole Engage | Sharala Lowe | 235 | 7.7 | N/A |
| | Independent | Peter George Pawlowski | 161 | 5.3 | -13.8 |
| Majority | | | |
| Turnout | 3,034 | 37.99 | |
| | Conservative hold | Swing | | |
| | Conservative hold | Swing | | |
Canford Heath
Canford Heath | Party | Candidate | Votes | % | ±% |
| | Liberal Democrats | Sandra Elizabeth Hazel Moore‡ | 2,199 | 65.7 | +9.4 |
| | Liberal Democrats | Chris Matthews‡ | 1,953 | 58.4 | +8.2 |
| | Liberal Democrats | Clare Elaine Weight | 1,575 | 47.1 | +2.9 |
| | Conservative | Sean Gabriel‡[a] | 1,124 | 33.6 | +7.8 |
| | Conservative | Helen Louise Lawrence | 828 | 24.8 | -0.2 |
| | Conservative | Manoj Pillai | 811 | 24.2 | +5.4 |
| | Labour | Janet Green | 388 | 11.6 | +0.2 |
| | Green | Pamela Margaret Jefferies | 296 | 8.8 | -0.8 |
| Majority | | | |
| Turnout | 3,345 | 31.34 | |
| | Liberal Democrats hold | Swing | | |
| | Liberal Democrats hold | Swing | | |
| | Liberal Democrats hold | Swing | | |
- ^ Elected in a by-election in May 2021
Christchurch Town
Christchurch Town | Party | Candidate | Votes | % | ±% |
| | Liberal Democrats | Mike Cox‡ | 1,619 | 53.8 | +24.2 |
| | Liberal Democrats | Michael John Tarling | 1,456 | 48.4 | +20.2 |
| | CI | Avril Elizabeth Coulton | 778 | 25.8 | +3.6 |
| | CI | Viv Charrett | 695 | 23.1 | +2.4 |
| | Conservative | John Trickett | 372 | 12.4 | -15.8 |
| | Conservative | Luc Wesley Swarbrick | 362 | 12.0 | -11.8 |
| | Labour | Julian Spurr | 208 | 6.9 | -4.6 |
| | Green | Sam Cato | 183 | 6.1 | -6.7 |
| | Green | Steven Miles Thomas | 117 | 3.9 | N/A |
| Majority | | | |
| Turnout | 3,010 | 37.24 | |
| | Liberal Democrats hold | Swing | | |
| | Liberal Democrats gain from Conservative | Swing | | |
Commons
Commons | Party | Candidate | Votes | % | ±% |
| | CI | Margaret Phipps‡ | 1,757 | 59.5 | +9.4 |
| | CI | Vanessa Helen Ricketts‡[a] | 1,574 | 53.3 | +1.4 |
| | Conservative | Tara Jane Fox | 414 | 14.0 | ±0.0 |
| | Liberal Democrats | Mark Stuart Davies | 380 | 12.9 | -1.8 |
| | Independent | Robin Thomas Adamson | 355 | 12.0 | N/A |
| | Green | Carol Ann Gardiner | 310 | 10.5 | N/A |
| | Labour | Peter Stokes | 294 | 9.9 | +2.8 |
| | Liberal Democrats | Cat Gold | 226 | 7.6 | -5.0 |
| | Conservative | Lynda Price | 226 | 7.6 | -5.3 |
| Majority | | | |
| Turnout | 2,955 | 37.13 | |
| | CI hold | Swing | | |
| | CI hold | Swing | | |
- ^ Elected in a by-election in May 2021
Creekmoor
Creekmoor | Party | Candidate | Votes | % | ±% |
| | Poole Engage | Judy Butt‡[a] | 960 | 44.8 | +6.0 |
| | Liberal Democrats | Paul Richard Slade | 774 | 36.1 | +13.1 |
| | Liberal Democrats | Paige Emma Stevens | 650 | 30.3 | +10.6 |
| | Poole Engage | Sarah Jayne Hollis | 645 | 30.1 | N/A |
| | Conservative | Bob Lister | 320 | 14.9 | -23.9 |
| | Conservative | Tony Reeves | 299 | 13.9 | -11.9 |
| | Labour | Neil John Duncan-Jordan | 281 | 13.1 | +3.8 |
| | Green | Diana Carolyn Tozer | 161 | 7.5 | -5.2 |
| Majority | | | |
| Turnout | 2,145 | 29.52 | |
| | Poole Engage gain from Conservative | Swing | | |
| | Liberal Democrats gain from UKIP | Swing | | |
- ^ Elected as Conservative, formed Poole Engage in June 2022
East Cliff and Springbourne
East Cliff and Springbourne | Party | Candidate | Votes | % | ±% |
| | Labour | Martin Joseph Bedford | 965 | 35.2 | +9.7 |
| | Labour | Anne-Marie Moriarty | 881 | 32.1 | +7.5 |
| | Conservative | Anne Brenda Filer‡ | 842 | 30.7 | -5.5 |
| | Green | Sara Louise Armstrong | 830 | 30.2 | +7.4 |
| | Conservative | David Anthony Kelsey‡ | 797 | 29.0 | -5.6 |
| | Conservative | Roberto Rocca‡ | 772 | 28.1 | -2.6 |
| | Labour | Declan George Stones | 757 | 27.6 | +4.0 |
| | Green | Paul Alexander Gray | 666 | 24.3 | N/A |
| | Green | Louise Samantha Kenchington | 658 | 24.0 | N/A |
| | Liberal Democrats | Ash Santini | 239 | 8.7 | -8.7 |
| | Liberal Democrats | Frank Hollowell | 238 | 8.7 | -7.4 |
| | Liberal Democrats | Dwaid Tyrone Edwin Coleman | 214 | 7.8 | -8.1 |
| Majority | | | |
| Turnout | 2,745 | 23.99 | |
| | Labour gain from Conservative | Swing | | |
| | Labour gain from Conservative | Swing | | |
| | Conservative hold | Swing | | |
East Southbourne and Tuckton
East Southbourne and Tuckton | Party | Candidate | Votes | % | ±% |
| | Liberal Democrats | Bernadette Patricia Nanovo | 1,660 | 52.6 | +32.3 |
| | Liberal Democrats | Judy Richardson | 1,642 | 52.1 | +40.8 |
| | Conservative | Eddie Coope‡ | 984 | 31.2 | -25.3 |
| | Conservative | Malcolm George Davies‡ | 865 | 27.4 | -22.5 |
| | Green | Jane Maria Bull | 334 | 10.6 | -11.8 |
| | Labour | Alan Davidson | 296 | 9.4 | +1.1 |
| | Labour | Jan Youngs | 248 | 7.9 | -4.2 |
| Majority | | | |
| Turnout | 3,153 | 42.66 | |
| | Liberal Democrats gain from Conservative | Swing | | |
| | Liberal Democrats gain from Conservative | Swing | | |
Hamworthy
Hamworthy | Party | Candidate | Votes | % | ±% |
| | Poole People | Brian Hitchcock | 849 | 33.5 | -18.1 |
| | Poole Engage | Julie Bagwell‡[a] | 759 | 30.0 | -21.6 |
| | Labour | Peter Jonathan Cooper | 720 | 28.4 | +14.0 |
| | Conservative | Mike White‡ | 656 | 25.9 | +1.3 |
| | Poole Engage | Daniel James Butt‡[b] | 630 | 24.9 | -20.0 |
| | Conservative | Mike Wilkins | 593 | 23.4 | +0.3 |
| | Liberal Democrats | Steve Robinson | 492 | 19.4 | +12.3 |
| | Conservative | Janet Mary Walton | 478 | 18.9 | -0.4 |
| | Poole Engage | Mohan Iyengar[c] | 463 | 18.3 | N/A |
| | Liberal Democrats | Jude Chapman | 385 | 15.2 | +9.0 |
| | Green | Yasmine Leila Osbourne | 367 | 14.5 | -0.1 |
| | Liberal Democrats | David Chapman | 333 | 13.1 | +7.9 |
| Majority | | | |
| Turnout | 2,534 | 24.25 | |
| | Poole People hold | Swing | | |
| | Poole Engage gain from Poole People | Swing | | |
| | Labour gain from Conservative | Swing | | |
- ^ Elected as Poole People, formed Poole Engage in June 2022
- ^ Elected as Poole People, formed Poole Engage in June 2022
- ^ Incumbent councillor for Canford Cliffs; elected as Conservative, formed Poole Engage in June 2022
Highcliffe and Walkford
Mudeford, Stanpit and West Highcliffe | Party | Candidate | Votes | % | ±% |
| | CI | Andy Martin‡[a] | 2,810 | 73.8 | +25.7 |
| | CI | David Francis Martin | 2,450 | 64.3 | +20.9 |
| | Conservative | Mike Ellis | 354 | 9.3 | -22.7 |
| | Independent | Nigel David Brooks‡ | 324 | 8.5 | -39.6 |
| | Liberal Democrats | Robin Alan Beresford Ede | 317 | 8.3 | -1.9 |
| | Labour | Lorraine Brown | 260 | 6.8 | -1.2 |
| | Green | Helen Frances Woodall | 220 | 5.8 | N/A |
| | Conservative | Efe Ohwofasa | 208 | 5.5 | -21.8 |
| | Reform UK | Vince Cable | 189 | 5.0 | N/A |
| | Liberal Democrats | Keith Harrison | 168 | 4.4 | -5.0 |
| | Communist | Carol Ann Wilcox | 40 | 1.0 | N/A |
| Majority | | | |
| Turnout | 3,810 | 44.05 | |
| | CI hold | Swing | | |
| | CI hold | Swing | | |
- ^ Elected in a by-election in October 2022
Kinson
Kinson | Party | Candidate | Votes | % | ±% |
| | Conservative | Cameron Ralph Adams | 1,092 | 36.7 | +9.4 |
| | Conservative | Duane William Farr‡ | 1,063 | 35.7 | +4.0 |
| | Labour Co-op | Michelle Andrea Dower | 1,062 | 35.7 | +12.1 |
| | Labour Co-op | Paul Victor Williams | 1,029 | 34.6 | +11.6 |
| | Conservative | Laurence Martin Peter Fear‡ | 964 | 32.4 | +2.7 |
| | Labour Co-op | Zach Eli David Griffiths | 958 | 32.2 | +10.3 |
| | Liberal Democrats | Neil Graeme Atkinson | 579 | 19.4 | +11.5 |
| | Liberal Democrats | Claire Smith | 560 | 18.8 | +11.2 |
| | Liberal Democrats | Richard Paul Smith | 473 | 15.9 | N/A |
| | Green | Jemima Jane Elizabeth Astill | 339 | 11.4 | -3.3 |
| | Independent | Sue Lennon | 277 | 9.3 | +2.8 |
| Majority | | | |
| Rejected ballots | 9 | 0.1 | |
| Turnout | 2,978 | 23.21 | -3.33 |
| | Conservative hold | Swing | | |
| | Conservative hold | Swing | | |
| | Labour Co-op gain from Conservative | Swing | | |
Littledown and Iford
Littledown and Iford | Party | Candidate | Votes | % | ±% |
| | Conservative | Lawrence Williams‡ | 940 | 39.3 | -8.7 |
| | Conservative | Bobbie Dove‡ | 892 | 37.3 | -9.7 |
| | Liberal Democrats | Catherine Alison Bishop | 802 | 33.6 | +11.0 |
| | Liberal Democrats | Chris Mayne | 572 | 23.9 | +11.2 |
| | Labour | Toni Elizabeth Colledge | 470 | 19.7 | +4.6 |
| | Labour | Patrick Francis Connolly | 448 | 18.8 | +5.5 |
| | Green | David John Thornton Ball | 428 | 17.9 | -4.5 |
| Majority | | | |
| Turnout | 2,389 | 31.75 | |
| | Conservative hold | Swing | | |
| | Conservative hold | Swing | | |
Moordown
Moordown | Party | Candidate | Votes | % | ±% |
| | Green | Alice Kate Salmon | 1,089 | 47.3 | +21.1 |
| | Green | Joe Angus Salmon | 904 | 39.3 | +16.3 |
| | Conservative | Sarah Catherine Anderson‡ | 637 | 27.7 | -12.3 |
| | Conservative | Beverley Ann Dunlop‡ | 582 | 25.3 | -2.9 |
| | Labour | Mary Apperley | 528 | 22.9 | +3.5 |
| | Labour | David Llewellyn Kelsey Stokes | 447 | 19.4 | +1.9 |
| | Liberal Democrats | Andrew David Hallam | 204 | 8.9 | N/A |
| Majority | | | |
| Turnout | 2,303 | 31.71 | |
| | Green gain from Conservative | Swing | | |
| | Green gain from Conservative | Swing | | |
Mudeford, Stanpit and West Highcliffe
Mudeford, Stanpit and West Highcliffe | Party | Candidate | Votes | % | ±% |
| | CI | Lesley Margaret Dedman‡ | 2,004 | 62.4 | +11.9 |
| | CI | Paul Alan Hilliard‡ | 1,784 | 55.5 | +7.9 |
| | Conservative | Claire Stephanie Bath | 923 | 28.7 | -3.6 |
| | Liberal Democrats | Sam Davies | 320 | 10.0 | -0.4 |
| | Liberal Democrats | Erin Samantha Tarling | 305 | 9.5 | +0.3 |
| | Green | Adie Saunders | 294 | 9.2 | N/A |
| | Labour | Ian Wands | 245 | 7.6 | +0.9 |
| Majority | | | |
| Turnout | 3,213 | 39.30 | |
| | CI hold | Swing | | |
| | CI hold | Swing | | |
Muscliff and Strouden Park
Muscliff and Strouden Park | Party | Candidate | Votes | % | ±% |
| | Independent | Kieron Wilson‡ | 1,595 | 44.8 | -6.7 |
| | Independent | Lisa Northover‡ | 1,227 | 34.4 | -3.9 |
| | Independent | Brian George Castle | 1,058 | 29.7 | N/A |
| | Conservative | Ian Charles Clark | 894 | 25.1 | +1.6 |
| | Independent | Liz Lucas | 879 | 24.7 | N/A |
| | Conservative | Derek Frank Borthwick‡ | 870 | 24.4 | -0.3 |
| | Conservative | Kierran Lister Paxton | 817 | 22.9 | +2.6 |
| | Labour | Farah Bassinder | 724 | 20.3 | +7.5 |
| | Labour | Robert Bassinder | 703 | 19.7 | +9.4 |
| | Labour | Johny M Skaria | 640 | 18.0 | +8.1 |
| | Liberal Democrats | Oliva Sidaway | 195 | 5.5 | N/A |
| | Liberal Democrats | Brian James Palmer | 188 | 5.3 | N/A |
| | Liberal Democrats | Martin Michael Sheppard | 157 | 4.4 | N/A |
| Majority | | | |
| Turnout | 3,562 | 28.41 | |
| | Independent hold | Swing | | |
| | Independent hold | Swing | | |
| | Independent gain from Conservative | Swing | | |
Newtown and Heatherlands
Newtown and Heatherlands | Party | Candidate | Votes | % | ±% |
| | Liberal Democrats | Millie Clementine Earl‡ | 1,966 | 62.5 | +16.8 |
| | Liberal Democrats | Marion Le Poidevin‡ | 1,717 | 54.6 | +12.7 |
| | Liberal Democrats | Sandra Mackrow | 1,609 | 51.1 | +15.6 |
| | Labour | Emma Lang | 706 | 22.4 | +4.3 |
| | Conservative | Malcolm Farrell | 695 | 22.1 | ±0.0 |
| | Green | Bruce Tomalin | 636 | 20.2 | -1.2 |
| | Conservative | Sylvia Alexandra Saxon | 600 | 19.1 | +0.3 |
| | Conservative | Louise Sarah Russell | 561 | 17.8 | +1.5 |
| Majority | | | |
| Turnout | 3,147 | 24.15 | |
| | Liberal Democrats hold | Swing | | |
| | Liberal Democrats hold | Swing | | |
| | Liberal Democrats hold | Swing | | |
Oakdale
Oakdale | Party | Candidate | Votes | % | ±% |
| | Poole People | Felicity Joy Rice‡[a] | 987 | 40.6 | +0.2 |
| | Poole People | Peter Francis Miles‡ | 914 | 37.6 | -13.2 |
| | Poole Engage | Steve Hayes | 460 | 18.9 | N/A |
| | Conservative | Sunil Kumar | 446 | 18.4 | -6.9 |
| | Conservative | Simon Peter Hollosi | 435 | 17.9 | -1.1 |
| | Labour | Alan Albert Daniels | 415 | 17.1 | +6.5 |
| | Poole Engage | Marie Patricia Pethen | 363 | 14.9 | N/A |
| | Liberal Democrats | Molly Charlotte Slade | 323 | 13.3 | +1.2 |
| | Liberal Democrats | David Herbert Brandwood | 309 | 12.7 | +1.1 |
| Majority | | | |
| Turnout | 2,430 | 29.08 | |
| | Poole People hold | Swing | | |
| | Poole People gain from ALL | Swing | | |
Parkstone
Parkstone | Party | Candidate | Votes | % | ±% |
| | Liberal Democrats | Crispin James Goodall | 1,284 | 44.1 | +23.5 |
| | Liberal Democrats | Emily Carrie Harman | 1,269 | 43.6 | +29.4 |
| | Conservative | Bryan Dion[a] | 652 | 22.4 | -9.1 |
| | Conservative | Ashley Fraser | 628 | 21.6 | -5.7 |
| | Poole People | Susan Jane Stockwell | 349 | 12.0 | -31.5 |
| | Poole People | Matilda Marie Northover | 337 | 11.6 | N/A |
| | Labour | Darren James Taylor | 332 | 11.4 | -2.2 |
| | Green | Ben Pantling | 287 | 9.9 | -6.4 |
| | Poole Engage | Steve Baron‡[b] | 278 | 9.6 | -33.9 |
| | Poole Engage | Elaine Joan Atkinson | 250 | 8.6 | N/A |
| Majority | | | |
| Turnout | 2,910 | 34.53 | |
| | Liberal Democrats gain from Poole People | Swing | | |
| | Liberal Democrats gain from Conservative | Swing | | |
- ^ Incumbent councillor for Penn Hill
- ^ Elected as Poole People, formed Poole Engage in June 2022
Penn Hill
Penn Hill | Party | Candidate | Votes | % | ±% |
| | Liberal Democrats | Jo Clements | 1,445 | 48.5 | +13.7 |
| | Liberal Democrats | Oliver John Walters | 1,196 | 40.2 | +8.7 |
| | Conservative | Remy John Aquilina | 851 | 28.6 | -6.6 |
| | Conservative | Tony O’Neill‡ | 735 | 24.7 | -14.9 |
| | Poole Engage | Sophie-Julienne Burnett | 413 | 13.9 | N/A |
| | Labour | Jake Oliver Ruggier | 382 | 12.8 | -2.8 |
| | Poole Engage | Nathelie Anna Tudberry | 353 | 11.9 | N/A |
| | Green | Helen Joanna Nicol | 294 | 9.9 | -16.3 |
| Majority | 2,978 | 34.24 | |
| Turnout | | | |
| | Liberal Democrats gain from Conservative | Swing | | |
| | Liberal Democrats gain from Conservative | Swing | | |
Poole Town
Poole Town | Party | Candidate | Votes | % | ±% |
| | Poole People | Andy Hadley‡ | 933 | 33.0 | -14.6 |
| | Poole People | Mark Edward Howell‡ | 925 | 32.7 | -15.2 |
| | Labour | Sue Aitkenhead | 841 | 29.7 | +7.4 |
| | Conservative | Gavin Scott Wright | 709 | 25.0 | +5.1 |
| | Conservative | Leanne Barnes | 705 | 24.9 | +5.6 |
| | Poole People | Charmaine Cassandra Parkinson | 701 | 24.8 | -21.5 |
| | Conservative | Sarah Therese O’Connell | 672 | 23.7 | +4.8 |
| | Green | Leo Jon Butterworth | 419 | 14.8 | N/A |
| | Liberal Democrats | Katharine Anne Palfrey | 406 | 14.3 | +4.5 |
| | Poole Engage | Christopher James Bulteel | 335 | 11.8 | N/A |
| | Poole Engage | Dave Butt | 310 | 11.0 | N/A |
| | Liberal Democrats | Mark Andrew Robson | 309 | 10.9 | +3.3 |
| | Liberal Democrats | Abbi Carolyn Slade | 304 | 10.7 | +4.4 |
| | Poole Engage | Ian Leslie Davies | 251 | 8.9 | N/A |
| Majority | | | |
| Turnout | 2,831 | 28.44 | |
| | Poole People hold | Swing | | |
| | Poole People hold | Swing | | |
| | Labour gain from Poole People | Swing | | |
Queen's Park
Queen's Park | Party | Candidate | Votes | % | ±% |
| | Green | Alasdair Keddie | 809 | 33.0 | +13.1 |
| | Labour | Sharon Lesley Carr-Brown | 808 | 32.9 | +16.3 |
| | Conservative | Mark Edward John Anderson‡ | 759 | 30.9 | -14.2 |
| | Green | Nicole Nagel | 746 | 30.4 | +15.1 |
| | Conservative | Cheryl Anne Johnson‡ | 693 | 28.2 | -10.6 |
| | Labour | Christopher Richard Talman | 594 | 24.2 | +9.6 |
| | Liberal Democrats | Lorraine Ann Crouch | 215 | 8.8 | -2.2 |
| | Liberal Democrats | Gillian Elizabeth Pardy | 170 | 6.9 | -4.5 |
| Majority | | | |
| Turnout | 2,455 | 31.69 | |
| | Green gain from Conservative | Swing | | |
| | Labour gain from Conservative | Swing | | |
Redhill and Northbourne
Redhill and Northbourne | Party | Candidate | Votes | % | ±% |
| | Independent | Stephen Gordon George Bartlett‡ | 844 | 38.9 | -10.3 |
| | Independent | Jackie Edwards‡[a] | 751 | 34.6 | +9.2 |
| | Conservative | Karen Jill Hay | 551 | 25.4 | ±0.0 |
| | Conservative | Daniel Charles Wilson | 503 | 23.2 | -1.4 |
| | Labour | Ruth Messer | 419 | 19.3 | +8.1 |
| | Labour | Ann Williams | 387 | 17.8 | +9.7 |
| | Liberal Democrats | Heather Margaret Dalziel | 273 | 12.6 | +3.3 |
| | Green | Carwyn Geraint Davies | 246 | 11.3 | +0.5 |
| | Liberal Democrats | Ines Antunovic Thomson | 193 | 8.9 | +2.9 |
| Majority | | | |
| Turnout | 2,170 | 28.71 | |
| | Independent hold | Swing | | |
| | Independent gain from Conservative | Swing | | |
- ^ Elected as Conservative
Talbot and Branksome Woods
Talbot and Branksome Woods | Party | Candidate | Votes | % | ±% |
| | Liberal Democrats | Matthew Stephen Gillett | 1,143 | 39.1 | +21.7 |
| | Conservative | Karen Alexis Rampton‡ | 1,073 | 36.7 | -6.7 |
| | Conservative | Philip Alan Broadhead‡ | 1,068 | 36.6 | -8.1 |
| | Liberal Democrats | Mark Battistini | 1,063 | 36.4 | +18.8 |
| | Conservative | Jane Newell | 1,024 | 35.1 | -9.4 |
| | Liberal Democrats | Daniel Parkin | 985 | 33.7 | +16.7 |
| | Green | Ian Charles Cunliffe | 413 | 14.1 | -6.6 |
| | Labour | Paul Forsdick | 391 | 13.4 | -0.6 |
| | Labour | Elaine Yiannaki | 372 | 12.7 | -1.0 |
| | Labour | Stephen Stones | 313 | 10.7 | -2.9 |
| | Heritage | Jim Burch | 181 | 6.2 | N/A |
| | No Description | Charlotte Robinson | 112 | 3.8 | N/A |
| Majority | | | |
| Turnout | 2,920 | 29.34 | |
| | Liberal Democrats gain from Conservative | Swing | | |
| | Conservative hold | Swing | | |
| | Conservative hold | Swing | | |
Wallisdown and Winton West
Wallisdown and Winton West | Party | Candidate | Votes | % | ±% |
| | Liberal Democrats | Olivia Maria Brown | 1,108 | 53.1 | +36.0 |
| | Liberal Democrats | Richard Herrett | 951 | 45.6 | +32.0 |
| | Conservative | Nigel Patrick Hedges‡ | 477 | 22.9 | -19.5 |
| | Conservative | Toby William Johnson[a] | 416 | 20.0 | -20.4 |
| | Labour | Julia Elizabeth Harding Drage | 352 | 16.9 | +0.7 |
| | Green | Matthew Peter Burgress | 318 | 15.3 | -5.5 |
| | Labour | Michael Cracknell | 303 | 14.5 | -2.9 |
| Majority | | | |
| Turnout | 2,085 | 28.79 | |
| | Liberal Democrats gain from Conservative | Swing | | |
| | Liberal Democrats gain from Conservative | Swing | | |
- ^ Incumbent councillor for Alderney & Bourne Valley; elected as Liberal Democrat
West Southbourne
West Southbourne | Party | Candidate | Votes | % | ±% |
| | Liberal Democrats | Brian Chick | 1,250 | 44.1 | +17.6 |
| | Liberal Democrats | Jeff Hanna | 1,209 | 42.6 | +16.4 |
| | Labour | Simon Patrick Adorian | 964 | 34.0 | +6.6 |
| | Labour | Joanne Oldale | 913 | 32.2 | +5.7 |
| | Conservative | Bob Lawton‡ | 461 | 16.2 | -10.8 |
| | Conservative | Ray Hatchard | 458 | 16.1 | -9.7 |
| | Green | Susan Graham | 246 | 8.7 | N/A |
| Majority | | | |
| Turnout | 2,837 | 37.94 | |
| | Liberal Democrats gain from Labour | Swing | | |
| | Liberal Democrats gain from Conservative | Swing | | |
Westbourne and West Cliff
Westbourne and West Cliff | Party | Candidate | Votes | % | ±% |
| | Conservative | John William Beesley ‡ | 974 | 41.3 | -6.8 |
| | Conservative | David D’Orton Gibson | 887 | 37.6 | -9.0 |
| | Liberal Democrats | Russell Paul Trent | 718 | 30.4 | +7.5 |
| | Liberal Democrats | Allan Turner Ward | 625 | 26.5 | +10.1 |
| | Labour | Jill Grower | 472 | 20.0 | +4.2 |
| | Green | Liz Elwick | 448 | 19.0 | -2.2 |
| | Labour | Daniel Moore | 351 | 14.9 | +4.0 |
| Rejected ballots | 18 | | |
| Majority | | | |
| Turnout | 2,359 | 28.72 | |
| | Conservative hold | Swing | | |
| | Conservative hold | Swing | | |
Winton East
Winton East | Party | Candidate | Votes | % | ±% |
| | Green | Simon Richard George Bull ‡ | 1,183 | 66.7 | +3.1 |
| | Green | Chris Rigby ‡ | 1,116 | 62.9 | +7.9 |
| | Conservative | Terry Ali | 278 | 15.7 | -5.8 |
| | Labour | Austin McCormack | 262 | 14.8 | -0.7 |
| | Conservative | Sash Jolliffe | 246 | 13.9 | -4.6 |
| | Labour | Mike Ramsdale | 241 | 13.6 | -1.5 |
| | Liberal Democrats | Paul Robert Dredge | 100 | 5.6 | N/A |
| Rejected ballots | 16 | 0.9 | |
| Majority | | | |
| Turnout | 1,774 | 24.74 | |
| | Green hold | Swing | | |
| | Green hold | Swing | | |
By-elections
East Cliff and Springbourne
Five days after the election, newly elected Labour councillor Martin Bedford for East Cliff and Springbourne resigned due to ill health.[20]
East Cliff and Springbourne: 29 June 2023 | Party | Candidate | Votes | % | ±% |
| | Green | Sara Armstrong | 817 | 38.4 | +9.5 |
| | Conservative | David Kelsey | 614 | 28.8 | –0.5 |
| | Labour | Declan Stones | 590 | 27.7 | –5.9 |
| | Liberal Democrats | Paul Radcliffe | 108 | 5.1 | –3.2 |
| Majority | 203 | 9.6 | |
| Turnout | 2,129 | 18.7 | |
| Registered electors | 11,385 | | |
| | Green gain from Labour | Swing | | |
Canford Cliffs
[21] Canford Cliffs: 2 May 2024 | Party | Candidate | Votes | % | ±% |
| | Conservative | Gavin Wright | 1,720 | 62.0 | |
| | Liberal Democrats | Ray Sparrow | 573 | 20.7 | |
| | Labour | Jim Buchanan | 317 | 11.4 | |
| | Green | Johnny Tutton | 163 | 5.9 | |
| Majority | 1,147 | 41.3 | |
| Turnout | 2,804 | 35.4 | |
| Registered electors | 7,918 | | |
| | Conservative hold | Swing | | |
References
- Notes
- Citations
- ^ "Election timetable in England". GOV.UK. Retrieved 28 June 2022.
- ^ "Bournemouth, Christchurch & Poole result - Local Elections 2023". BBC News. Retrieved 8 May 2023.
- ^ "BCP Council elections 2023: results at a glance by ward". Bournemouth Echo. 6 May 2023. Retrieved 8 May 2023.
- ^ "New Leader of BCP Council elected". Bournemouth, Christchurch and Poole Council. 23 May 2023. Retrieved 18 May 2024.
- ^ Almroth-Wright, Indy (24 May 2023). "BCP council to be run by coalition led by Lib Dem Vikki Slade". BBC News. Retrieved 18 May 2024.
- ^ "Your councillors". Bournemouth, Christchurch and Poole Council. Retrieved 4 May 2023.
- ^ White, Marcus; Hudson, Emily (29 April 2023). "Local Elections 2023: Bournemouth, Christchurch and Poole". BBC News. Retrieved 4 May 2023.
- ^ "Bournemouth councillor will continue role after Manchester election failure". Bournemouth Echo. 10 May 2022. Retrieved 3 April 2023.
- ^ "Poole councillor calling time after more than 20 years representing Broadstone". Bournemouth Echo. 3 November 2022. Retrieved 3 November 2022.
- ^ "IN FULL: Statement from Drew Mellor on decision to resign as BCP Council leader". uk.news.yahoo.com. 13 February 2023. Retrieved 13 February 2023.
- ^ "Two Conservative BCP Council members not standing for re-election". bournemouthecho.co.uk/. 25 February 2023. Retrieved 25 February 2023.
- ^ "Two Conservative BCP Council members not standing for re-election". bournemouthecho.co.uk/. 25 February 2023. Retrieved 25 February 2023.
- ^ "Parkstone councillor Ann Stribley calls time on 46 years in role". bournemouthecho.co.uk/. 30 March 2023. Retrieved 2 April 2023.
- ^ a b "LISTED: Who is standing to be a councillor in next month's BCP Council elections". Bournemouth Echo. Retrieved 6 April 2023.
- ^ "'Blown away': Liberal Democrats storm into largest BCP Council party after election". Bournemouth Echo. 6 May 2023. Retrieved 11 May 2023.
- ^ "Conservative leader says election focused on national issues as council seats plummet". Bournemouth Echo. 6 May 2023. Retrieved 11 May 2023.
- ^ "Labour vows to 'punch well above our weight' after BCP Council election gains". Bournemouth Echo. 6 May 2023. Retrieved 11 May 2023.
- ^ "'Big change in Bournemouth': Green Party celebrating BCP Council gains". Bournemouth Echo. 8 May 2023. Retrieved 11 May 2023.
- ^ "Bournemouth, Christchurch & Poole result - Local Elections 2023". BBC News. Retrieved 11 May 2023.
- ^ "Labour councillor resigns five days after election success in Bournemouth ward". Bournemouth Echo. 10 May 2023. Retrieved 11 May 2023.
- ^ "Canford Cliffs by-election results (2 May 2024)". BCP Council. 3 May 2024. Retrieved 3 May 2024.


 13
13  24
24 
 Council elections in Dorset


