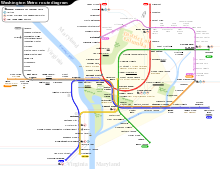
Infografik

Infografik (gabungan "informasi" (maklumat) dan "grafik") ialah gambaran visual grafik maklumat, data, atau pengetahuan bertujuan untuk menyampaikan maklumat dengan cepat dan jelas.[1][2] Mereka dapat meningkatkan kognisi dengan menggunakan grafik untuk meningkatkan kemampuan sistem visual manusia untuk melihat corak dan tren.[3][4] Usaha serupa ialah pemvisualan maklumat, pemvisualan data, grafik statistik, reka bentuk maklumat, atau seni bina maklumat.[2] Infografik telah berkembang dalam beberapa tahun kebelakangan untuk menjadi komunikasi massa, dan dengan demikian direka dengan lebih sedikit asumsi mengenai asas pengetahuan pembaca daripada jenis pemvisualan lain.[5] Isotip ialah contoh awal infografik menyampaikan maklumat dengan cepat dan mudah kepada orang ramai.[6]
Rujukan
- ^ Doug Newsom and Jim Haynes (2004). Public Relations Writing: Form and Style. p.236.
- ^ a b Smiciklas, Mark (2012). The Power of Infographics: Using Pictures to Communicate and Connect with Your Audiences. ISBN 9780789749499.
- ^ Heer, Jeffrey; Bostock, Michael; Ogievetsky, Vadim (2010). "A tour through the visualization zoo". Communications of the ACM. 53 (6): 59–67. doi:10.1145/1743546.1743567.
- ^ Card, S. (2009). Information visualization. In A. Sears & J. A. Jacko (Eds.), Human-Computer Interaction: Design Issues, Solutions, and Applications (pp. 510-543). Boca Raton, FL: CRC Press.
- ^ Zaman, Jazib (2019-05-31). "Infographics; a form of visual content". TechEngage (dalam bahasa Inggeris). TechEngage. Dicapai pada 2019-06-14.
- ^ "The Power of Infographics: Using Pictures to Communicate and Connect with your audience". Mark Smiciklas. Dicapai pada July 17, 2017.
Bacaan lanjut
- Heiner Benking (1981–1988) Requisite inquiry and time-line: computer graphics-infographics http://benking.de/infographics/ Diarkibkan 2012-11-28 di Wayback Machine see there: Computer Graphics in the Environmental Sector – Possibilities and Limitations of Data-visualisation this citation in chapter 3: technical possibilities and human potentials and capacities, "a picture is more than 10.000 words", and "10.000 miles equal 10.000 books".
- Sullivan, Peter. (1987) Newspaper Graphics. IFRA, Darmstadt.
- Jacques Bertin (1983). Semiology of Graphics. Madison, WI: University of Wisconsin Press. Translation by William Berg of Semiologie Graphique. Paris: Mouton/Gauthier-Villars, 1967.
- William S. Cleveland (1985). The Elements of Graphing Data. Summit, NJ: Hobart Press. ISBN 978-1-58465-512-1
- Heiner Benking (1993), Visual Access Strategies for Multi-Dimensional Objects and Issues / "Our View of Life is too Flat", WFSF, Turku, FAW Report TR-93019
- William S. Cleveland (1993). Visualizing Data. Summit, NJ: Hobart Press. ISBN 978-0-9634884-0-4
- Sullivan, Peter. (1993) Information Graphics in Colour. IFRA, Darmstadt.
- John Emerson (2008). Visualizing Information for Advocacy: An Introduction to Information Design. New York: OSI.
- Paul Lewi (2006). "Speaking of Graphics".
- Hankins, Thomas L. (1999). "Blood, Dirt, and Nomograms: A Particular History of Graphs". Isis. 90 (1): 50–80. doi:10.1086/384241. JSTOR 237474.
- Robert L. Harris (1999). Information Graphics: A Comprehensive Illustrated Reference. Oxford University Press.
- Eric K. Meyer (1997). Designing Infographics. Hayden Books.
- Edward R. Tufte (1983). The Visual Display of Quantitative Information. Edition, Cheshire, CT: Graphics Press.
- Edward R. Tufte (1990). Envisioning Information. Cheshire, CT: Graphics Press.
- Edward R. Tufte (1997). Visual Explanations: Images and Quantities, Evidence and Narrative. Cheshire,
- Edward R. Tufte (2006). Beautiful Evidence. Cheshire. CT: Graphics Press.
- John Wilder Tukey (1977). Exploratory Data Analysis. Addison-Wesley.
- Veszelszki, Ágnes (2014). Information visualization: Infographics from a linguistic point of view. In: Benedek, András − Nyíri, Kristóf (eds.): The Power of the Image Series Visual Learning, vol. 4. Frankfurt: Peter Lang, pp. 99−109.
- Sandra Rendgen, Julius Wiedemann (2012). Information Graphics. Taschen Publishing. ISBN 978-3-8365-2879-5
- Jason Lankow, Josh Ritchie, Ross Crooks (2012). Infographics: The Power of Visual Storytelling. Wiley. ISBN 978-1-118-31404-3
Pautan luar
- Milestones in the History of Thematic Cartography, Statistical Graphics and Data Visualization
- Visual Display of Quantitative Information


